

On-Time Performance
Last mile on-time performance for 2023 lags 2022 performance year-to-date.
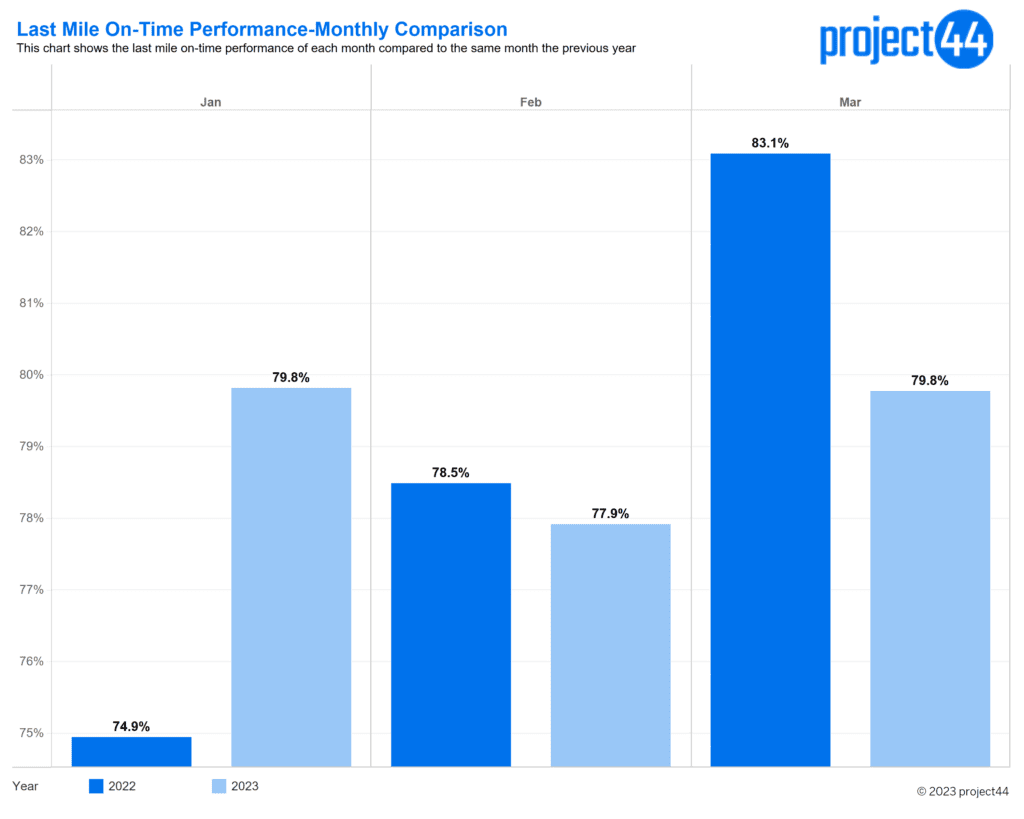
2023 appeared to be off to a strong start for last mile on-time performance with January 2023 exceeding January 2022 by nearly 5%. This trend, however, has not continued throughout February and March. In February, there was a 2.8% decrease from January performance. This is very atypical for last mile as January generally has lower on-time performance as the market recovers from the peak season November-December and works to process the influx of holiday returns. With that being said, the February on-time performance was less than 1% lower than February 2022.
In March 2023, we saw an increase of 2% from February 2023, but the gap between 2022 and 2023 continued to grow. March 2022 outperformed March 2023 by 3.3%.
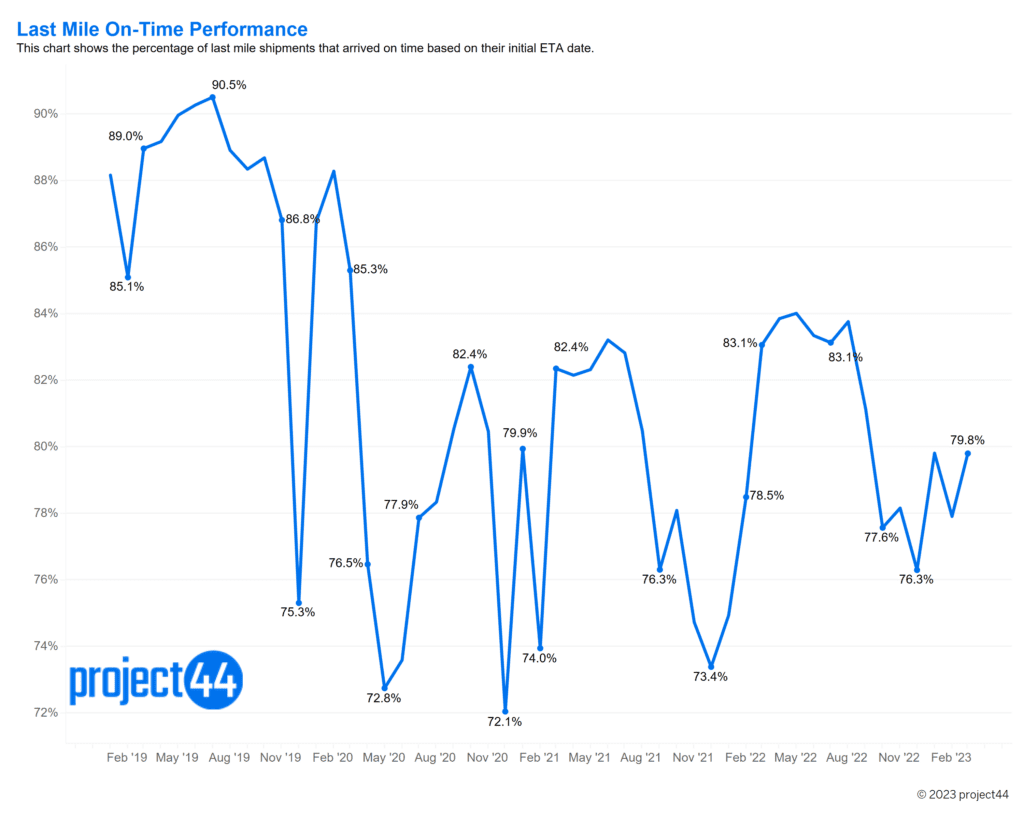
Looking at long-term on-time performance, the market is still seeing an overall upwards trend in on-time performance. Peak season 2022 was the highest performing peak season including the pre-covid 2019 season. While there is still volatility in performance, the spikes are less severe indicating a more stable last mile environment.
Click-to-Delivery Time
Click-to-delivery time measures the amount of time a consumer waits for their order from the time they place it to when it is delivered. 2023 has seen very stable numbers for this metric so far.
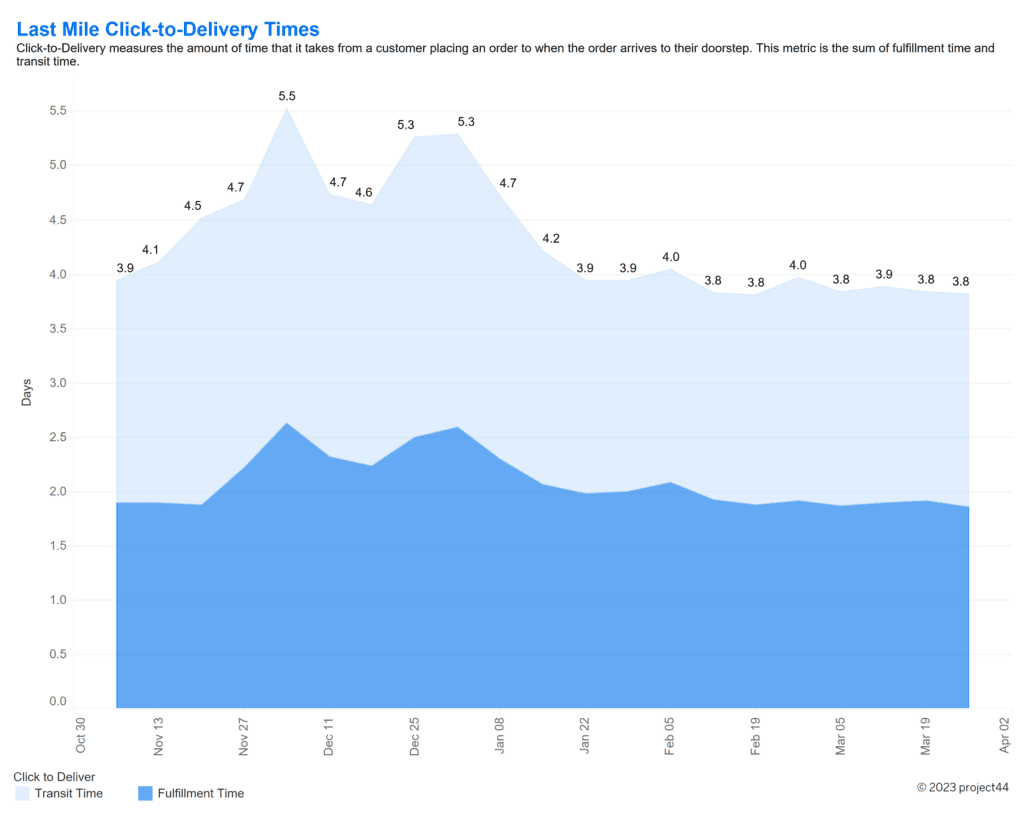
As anticipated, peak season volumes contributed to an increase in click-to-delivery time from November through December, but this number has quickly recovered and remained between 3.8 and 4 days. This shows that not only are we seeing more stability in last mile transportation, but many of the labor issues that plagued warehouses over the past year have been resolved for the time being.
Carrier Diversification
Overall, carrier diversification is continuing to increase.
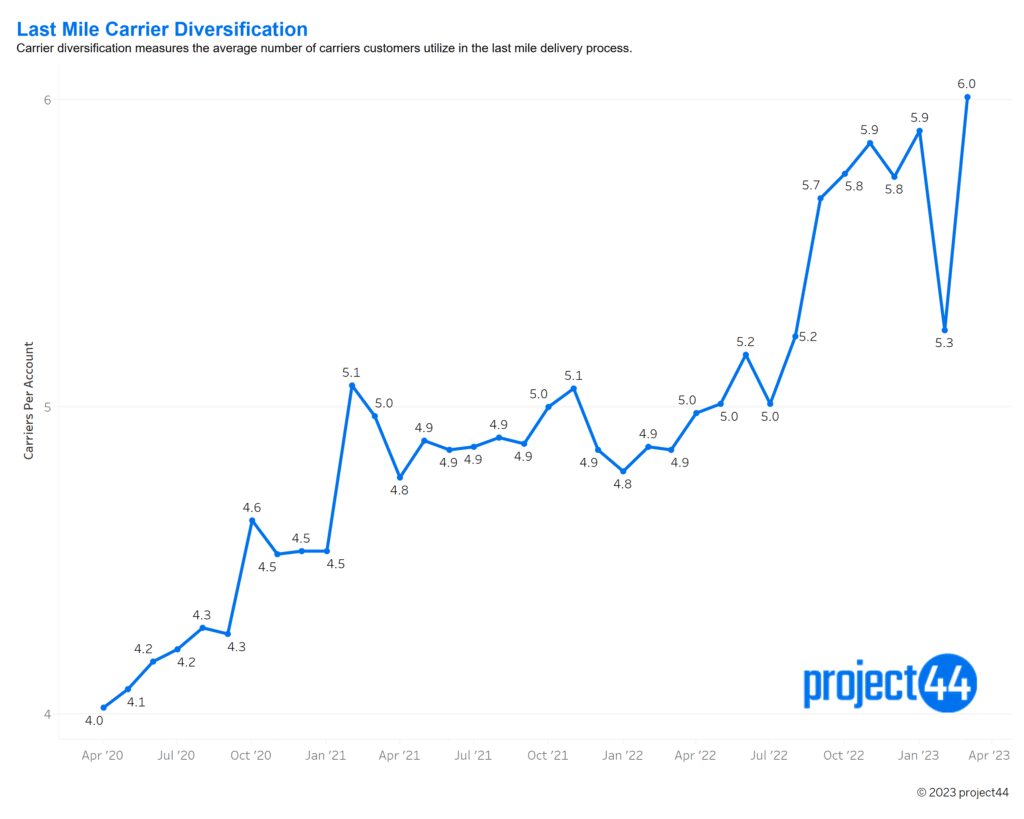
Since 2020, there has been an effort by retailers to increase their carrier diversification to mitigate supply chain risks and increase agility. Overall, this trend continues to be the case, with March 2023 having a high of 6 carriers on average per account. We did see this number drop to 5.3 carriers in February. The cause of this could be the decrease in order volume following peak season, leading retailers to need fewer carriers to fulfill the order capacity.
About project44
project44 is on a mission to make supply chains work. As the supply chain connective tissue, project44 operates the world’s most trusted end-to-end visibility platform that tracks more than 1 billion shipments annually for over 1,200 of the leading brands, including top companies in manufacturing, automotive, retail, life sciences, food & beverage, and oil, chemical & gas. Using project44, shippers and carriers across the globe drive greater predictability, resiliency and sustainability.
The undisputed leader in the market, project44 was named the Leader in the Gartner Magic Quadrant, #1 in FreightWaves FreightTech 2022, the Customer’s Choice in Gartner Peer Insights Voice of the Customer report. project44 is headquartered in Chicago with a diverse team spanning 17 global offices. To learn more, visit www.project44.com.
For questions or comments:
press@project44.com
Disclaimer: The information conveyed herein, shared solely for summary and not contractual purposes, comes from both project44 and third-party reporting. The project44 data does not include all available market information, and project44 has not undertaken to independently verify the third-party reporting. Similarly, this type of data changes from day-to-day. Accordingly, the reader should not rely on this reporting to make any business decisions, and project44 expressly disavows any liability arising from any such reliance.
Back to More